Knowing your numbers matters! The same goes for knowing your email stats! That’s why we making checking your delivery numbers is super easy.
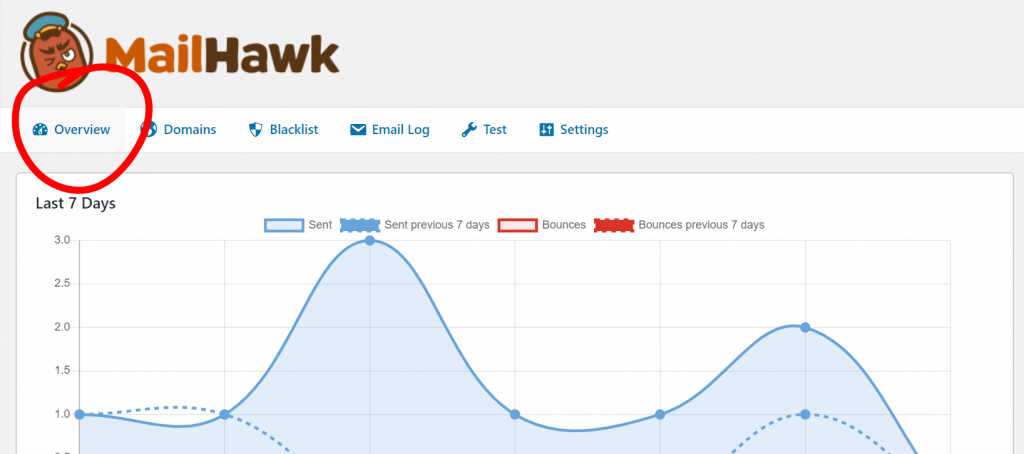
Go to tools > MailHawk and you will be brought directly to the reports page.
The main graph will show you your sending stats over the last 7 days.
- The solid blue line indicates the number of emails sent for that day.
- The dotted blue line shows the number of emails sent 7 days prior for comparison.
- The solid red line shows the number of emails which bounced for the day.
- The dotted red line shows the number of emails which bounced 7 days prior for comparison.
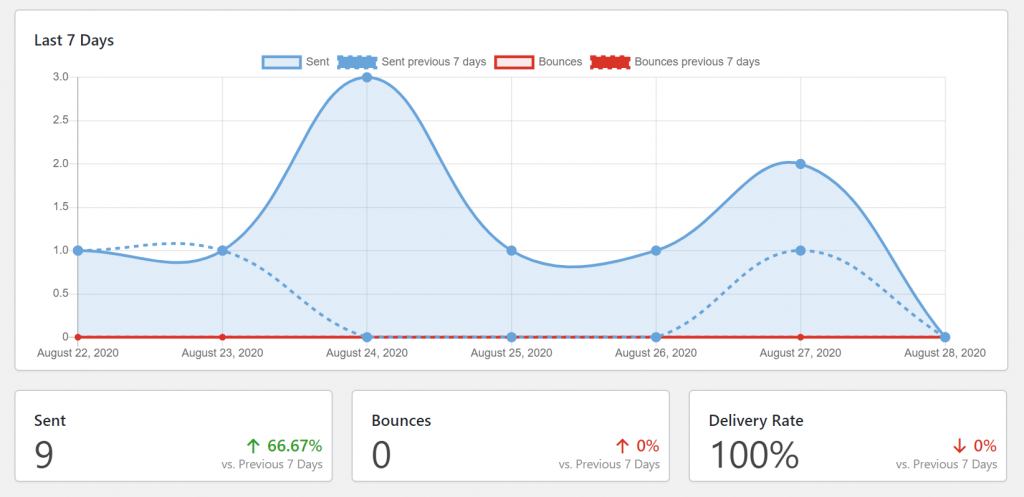
underneath the graph there are some quick numbers for you to check the total number of emails sent, the delivery rate and the total number of bounces.
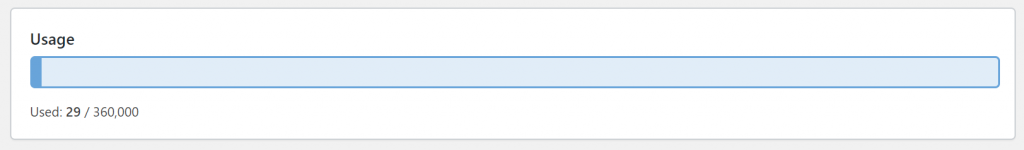
At the bottom of the screen you can see your sending quota for that month.